BARODA BNP PARIBAS ELSS Tax Saver Fund - Regular - Growth Option
| Category: Equity: ELSS |
| Launch Date: 05-01-2006 |
| Asset Class: |
| Benchmark: NIFTY 500 TRI |
| Expense Ratio: 2.22% As on (31-08-2025) |
| Status: Open Ended Schemes |
| Minimum Investment: 500.0 |
| Minimum Topup: 500.0 |
| Total Assets: 911.15 Cr As on (31-07-2025) |
| Turn over: 89% |
94.8311
0.36 (0.3792%)
12.1%
NIFTY 500 TRI 12.44%
PERFORMANCE of BARODA BNP PARIBAS ELSS Tax Saver Fund - Regular - Growth Option
Scheme Performance (%)
Data as on - 09-09-2025Yearly Performance (%)
Fund Managers
Mr. Sanjay Chawla and Mr. Pratish Krishnan, Mr. Miten Vora (Dedicated Overseas Fund Manager)
Investment Objective
The investment objective of the Scheme is to generate long-term capital growth from a diversified and actively managed portfolio of equity and equity related securities along with income tax rebate, as may be prevalent from time to time.
MONTHLY LUMPSUM RETURNS ( Invested amount 1,00,000)
| NAV Date | NAV | Units | Market Value |
Returns (%) |
|---|---|---|---|---|
| 05-01-2006 | 10.0 | 10000.0 | 100000 | 0.0 % |
| 06-02-2006 | 10.809 | 10000.0 | 108090 | 8.09 % |
| 06-03-2006 | 11.738 | 10000.0 | 117380 | 17.38 % |
| 05-04-2006 | 12.991 | 10000.0 | 129910 | 29.91 % |
| 05-05-2006 | 14.6 | 10000.0 | 146000 | 46.0 % |
| 05-06-2006 | 11.161 | 10000.0 | 111610 | 11.61 % |
| 05-07-2006 | 10.634 | 10000.0 | 106340 | 6.34 % |
| 07-08-2006 | 10.368 | 10000.0 | 103680 | 3.68 % |
| 05-09-2006 | 11.469 | 10000.0 | 114690 | 14.69 % |
| 05-10-2006 | 12.116 | 10000.0 | 121160 | 21.16 % |
| 06-11-2006 | 12.988 | 10000.0 | 129880 | 29.88 % |
| 05-12-2006 | 14.145 | 10000.0 | 141450 | 41.45 % |
| 05-01-2007 | 14.314 | 10000.0 | 143140 | 43.14 % |
| 05-02-2007 | 14.149 | 10000.0 | 141490 | 41.49 % |
| 05-03-2007 | 11.598 | 10000.0 | 115980 | 15.98 % |
| 05-04-2007 | 11.761 | 10000.0 | 117610 | 17.61 % |
| 07-05-2007 | 12.701 | 10000.0 | 127010 | 27.01 % |
| 05-06-2007 | 13.924 | 10000.0 | 139240 | 39.24 % |
| 05-07-2007 | 14.703 | 10000.0 | 147030 | 47.03 % |
| 06-08-2007 | 14.766 | 10000.0 | 147660 | 47.66 % |
| 05-09-2007 | 15.556 | 10000.0 | 155560 | 55.56 % |
| 05-10-2007 | 16.857 | 10000.0 | 168570 | 68.57 % |
| 05-11-2007 | 19.588 | 10000.0 | 195880 | 95.88 % |
| 05-12-2007 | 20.852 | 10000.0 | 208520 | 108.52 % |
| 07-01-2008 | 22.479 | 10000.0 | 224790 | 124.79 % |
| 05-02-2008 | 17.976 | 10000.0 | 179760 | 79.76 % |
| 05-03-2008 | 14.927 | 10000.0 | 149270 | 49.27 % |
| 07-04-2008 | 13.326 | 10000.0 | 133260 | 33.26 % |
| 05-05-2008 | 14.756 | 10000.0 | 147560 | 47.56 % |
| 05-06-2008 | 12.705 | 10000.0 | 127050 | 27.05 % |
| 07-07-2008 | 10.706 | 10000.0 | 107060 | 7.06 % |
| 05-08-2008 | 11.74 | 10000.0 | 117400 | 17.4 % |
| 05-09-2008 | 11.479 | 10000.0 | 114790 | 14.79 % |
| 06-10-2008 | 9.231 | 10000.0 | 92310 | -7.69 % |
| 05-11-2008 | 7.867 | 10000.0 | 78670 | -21.33 % |
| 05-12-2008 | 7.11 | 10000.0 | 71100 | -28.9 % |
| 05-01-2009 | 7.902 | 10000.0 | 79020 | -20.98 % |
| 05-02-2009 | 7.16 | 10000.0 | 71600 | -28.4 % |
| 05-03-2009 | 6.557 | 10000.0 | 65570 | -34.43 % |
| 06-04-2009 | 7.78 | 10000.0 | 77800 | -22.2 % |
| 05-05-2009 | 8.639 | 10000.0 | 86390 | -13.61 % |
| 05-06-2009 | 10.67 | 10000.0 | 106700 | 6.7 % |
| 06-07-2009 | 10.073 | 10000.0 | 100730 | 0.73 % |
| 05-08-2009 | 11.406 | 10000.0 | 114060 | 14.06 % |
| 07-09-2009 | 11.674 | 10000.0 | 116740 | 16.74 % |
| 05-10-2009 | 12.146 | 10000.0 | 121460 | 21.46 % |
| 05-11-2009 | 11.821 | 10000.0 | 118210 | 18.21 % |
| 07-12-2009 | 12.556 | 10000.0 | 125560 | 25.56 % |
| 05-01-2010 | 13.1 | 10000.0 | 131000 | 31.0 % |
| 05-02-2010 | 11.903 | 10000.0 | 119030 | 19.03 % |
| 05-03-2010 | 12.795 | 10000.0 | 127950 | 27.95 % |
| 05-04-2010 | 13.255 | 10000.0 | 132550 | 32.55 % |
| 05-05-2010 | 12.947 | 10000.0 | 129470 | 29.47 % |
| 07-06-2010 | 12.636 | 10000.0 | 126360 | 26.36 % |
| 05-07-2010 | 13.465 | 10000.0 | 134650 | 34.65 % |
| 05-08-2010 | 13.899 | 10000.0 | 138990 | 38.99 % |
| 06-09-2010 | 14.528 | 10000.0 | 145280 | 45.28 % |
| 05-10-2010 | 15.514 | 10000.0 | 155140 | 55.14 % |
| 08-11-2010 | 15.704 | 10000.0 | 157040 | 57.04 % |
| 06-12-2010 | 14.742 | 10000.0 | 147420 | 47.42 % |
| 05-01-2011 | 14.666 | 10000.0 | 146660 | 46.66 % |
| 07-02-2011 | 13.007 | 10000.0 | 130070 | 30.07 % |
| 07-03-2011 | 12.839 | 10000.0 | 128390 | 28.39 % |
| 05-04-2011 | 13.96 | 10000.0 | 139600 | 39.6 % |
| 05-05-2011 | 13.568 | 10000.0 | 135680 | 35.68 % |
| 06-06-2011 | 13.96 | 10000.0 | 139600 | 39.6 % |
| 05-07-2011 | 14.324 | 10000.0 | 143240 | 43.24 % |
| 05-08-2011 | 13.909 | 10000.0 | 139090 | 39.09 % |
| 05-09-2011 | 13.648 | 10000.0 | 136480 | 36.48 % |
| 05-10-2011 | 13.186 | 10000.0 | 131860 | 31.86 % |
| 08-11-2011 | 14.031 | 10000.0 | 140310 | 40.31 % |
| 05-12-2011 | 13.48 | 10000.0 | 134800 | 34.8 % |
| 05-01-2012 | 12.728 | 10000.0 | 127280 | 27.28 % |
| 06-02-2012 | 14.183 | 10000.0 | 141830 | 41.83 % |
| 05-03-2012 | 14.081 | 10000.0 | 140810 | 40.81 % |
| 09-04-2012 | 14.314 | 10000.0 | 143140 | 43.14 % |
| 07-05-2012 | 14.061 | 10000.0 | 140610 | 40.61 % |
| 05-06-2012 | 13.623 | 10000.0 | 136230 | 36.23 % |
| 05-07-2012 | 14.799 | 10000.0 | 147990 | 47.99 % |
| 06-08-2012 | 14.633 | 10000.0 | 146330 | 46.33 % |
| 05-09-2012 | 14.66 | 10000.0 | 146600 | 46.6 % |
| 05-10-2012 | 15.75 | 10000.0 | 157500 | 57.5 % |
| 05-11-2012 | 15.737 | 10000.0 | 157370 | 57.37 % |
| 05-12-2012 | 16.615 | 10000.0 | 166150 | 66.15 % |
| 07-01-2013 | 17.218 | 10000.0 | 172180 | 72.18 % |
| 05-02-2013 | 16.832 | 10000.0 | 168320 | 68.32 % |
| 05-03-2013 | 16.278 | 10000.0 | 162780 | 62.78 % |
| 05-04-2013 | 15.577 | 10000.0 | 155770 | 55.77 % |
| 06-05-2013 | 16.469 | 10000.0 | 164690 | 64.69 % |
| 05-06-2013 | 16.47 | 10000.0 | 164700 | 64.7 % |
| 05-07-2013 | 16.161 | 10000.0 | 161610 | 61.61 % |
| 05-08-2013 | 15.951 | 10000.0 | 159510 | 59.51 % |
| 05-09-2013 | 15.927 | 10000.0 | 159270 | 59.27 % |
| 07-10-2013 | 16.838 | 10000.0 | 168380 | 68.38 % |
| 05-11-2013 | 17.826 | 10000.0 | 178260 | 78.26 % |
| 05-12-2013 | 17.743 | 10000.0 | 177430 | 77.43 % |
| 06-01-2014 | 17.961 | 10000.0 | 179610 | 79.61 % |
| 05-02-2014 | 17.455 | 10000.0 | 174550 | 74.55 % |
| 05-03-2014 | 18.045 | 10000.0 | 180450 | 80.45 % |
| 07-04-2014 | 19.315 | 10000.0 | 193150 | 93.15 % |
| 05-05-2014 | 19.271 | 10000.0 | 192710 | 92.71 % |
| 05-06-2014 | 22.642 | 10000.0 | 226420 | 126.42 % |
| 07-07-2014 | 24.23 | 10000.0 | 242300 | 142.3 % |
| 05-08-2014 | 24.107 | 10000.0 | 241070 | 141.07 % |
| 05-09-2014 | 25.74 | 10000.0 | 257400 | 157.4 % |
| 07-10-2014 | 25.576 | 10000.0 | 255760 | 155.76 % |
| 05-11-2014 | 26.843 | 10000.0 | 268430 | 168.43 % |
| 05-12-2014 | 27.782 | 10000.0 | 277820 | 177.82 % |
| 05-01-2015 | 28.202 | 10000.0 | 282020 | 182.02 % |
| 05-02-2015 | 29.51 | 10000.0 | 295100 | 195.1 % |
| 05-03-2015 | 30.395 | 10000.0 | 303950 | 203.95 % |
| 06-04-2015 | 30.906 | 10000.0 | 309060 | 209.06 % |
| 05-05-2015 | 29.312 | 10000.0 | 293120 | 193.12 % |
| 05-06-2015 | 29.224 | 10000.0 | 292240 | 192.24 % |
| 06-07-2015 | 30.898 | 10000.0 | 308980 | 208.98 % |
| 05-08-2015 | 31.643 | 10000.0 | 316430 | 216.43 % |
| 07-09-2015 | 27.971 | 10000.0 | 279710 | 179.71 % |
| 05-10-2015 | 29.93 | 10000.0 | 299300 | 199.3 % |
| 05-11-2015 | 28.922 | 10000.0 | 289220 | 189.22 % |
| 07-12-2015 | 28.925 | 10000.0 | 289250 | 189.25 % |
| 05-01-2016 | 29.27 | 10000.0 | 292700 | 192.7 % |
| 05-02-2016 | 27.493 | 10000.0 | 274930 | 174.93 % |
| 08-03-2016 | 26.999 | 10000.0 | 269990 | 169.99 % |
| 05-04-2016 | 27.728 | 10000.0 | 277280 | 177.28 % |
| 05-05-2016 | 28.677 | 10000.0 | 286770 | 186.77 % |
| 06-06-2016 | 29.47 | 10000.0 | 294700 | 194.7 % |
| 05-07-2016 | 30.229 | 10000.0 | 302290 | 202.29 % |
| 05-08-2016 | 31.497 | 10000.0 | 314970 | 214.97 % |
| 06-09-2016 | 32.179 | 10000.0 | 321790 | 221.79 % |
| 05-10-2016 | 31.854 | 10000.0 | 318540 | 218.54 % |
| 07-11-2016 | 30.795 | 10000.0 | 307950 | 207.95 % |
| 05-12-2016 | 28.51 | 10000.0 | 285100 | 185.1 % |
| 05-01-2017 | 28.317 | 10000.0 | 283170 | 183.17 % |
| 06-02-2017 | 30.834 | 10000.0 | 308340 | 208.34 % |
| 06-03-2017 | 30.809 | 10000.0 | 308090 | 208.09 % |
| 05-04-2017 | 32.823 | 10000.0 | 328230 | 228.23 % |
| 05-05-2017 | 33.883 | 10000.0 | 338830 | 238.83 % |
| 05-06-2017 | 34.611 | 10000.0 | 346110 | 246.11 % |
| 05-07-2017 | 35.507 | 10000.0 | 355070 | 255.07 % |
| 07-08-2017 | 36.436 | 10000.0 | 364360 | 264.36 % |
| 05-09-2017 | 36.571 | 10000.0 | 365710 | 265.71 % |
| 05-10-2017 | 36.542 | 10000.0 | 365420 | 265.42 % |
| 06-11-2017 | 38.609 | 10000.0 | 386090 | 286.09 % |
| 05-12-2017 | 38.119 | 10000.0 | 381190 | 281.19 % |
| 05-01-2018 | 40.151 | 10000.0 | 401510 | 301.51 % |
| 05-02-2018 | 37.513 | 10000.0 | 375130 | 275.13 % |
| 05-03-2018 | 36.592 | 10000.0 | 365920 | 265.92 % |
| 05-04-2018 | 36.895 | 10000.0 | 368950 | 268.95 % |
| 07-05-2018 | 37.56 | 10000.0 | 375600 | 275.6 % |
| 05-06-2018 | 36.082 | 10000.0 | 360820 | 260.82 % |
| 05-07-2018 | 36.353 | 10000.0 | 363530 | 263.53 % |
| 06-08-2018 | 37.713 | 10000.0 | 377130 | 277.13 % |
| 05-09-2018 | 37.251 | 10000.0 | 372510 | 272.51 % |
| 05-10-2018 | 33.726 | 10000.0 | 337260 | 237.26 % |
| 05-11-2018 | 34.598 | 10000.0 | 345980 | 245.98 % |
| 05-12-2018 | 35.412 | 10000.0 | 354120 | 254.12 % |
| 07-01-2019 | 35.95 | 10000.0 | 359500 | 259.5 % |
| 05-02-2019 | 35.901 | 10000.0 | 359010 | 259.01 % |
| 05-03-2019 | 35.886 | 10000.0 | 358860 | 258.86 % |
| 05-04-2019 | 37.642 | 10000.0 | 376420 | 276.42 % |
| 06-05-2019 | 37.593 | 10000.0 | 375930 | 275.93 % |
| 06-06-2019 | 39.041 | 10000.0 | 390410 | 290.41 % |
| 05-07-2019 | 39.007 | 10000.0 | 390070 | 290.07 % |
| 05-08-2019 | 36.878 | 10000.0 | 368780 | 268.78 % |
| 05-09-2019 | 36.851 | 10000.0 | 368510 | 268.51 % |
| 07-10-2019 | 38.449 | 10000.0 | 384490 | 284.49 % |
| 05-11-2019 | 40.392 | 10000.0 | 403920 | 303.92 % |
| 05-12-2019 | 40.775 | 10000.0 | 407750 | 307.75 % |
| 06-01-2020 | 40.758 | 10000.0 | 407580 | 307.58 % |
| 05-02-2020 | 42.641 | 10000.0 | 426410 | 326.41 % |
| 05-03-2020 | 40.661 | 10000.0 | 406610 | 306.61 % |
| 07-04-2020 | 32.601 | 10000.0 | 326010 | 226.01 % |
| 05-05-2020 | 33.685 | 10000.0 | 336850 | 236.85 % |
| 05-06-2020 | 36.82 | 10000.0 | 368200 | 268.2 % |
| 06-07-2020 | 38.365 | 10000.0 | 383650 | 283.65 % |
| 05-08-2020 | 39.695 | 10000.0 | 396950 | 296.95 % |
| 07-09-2020 | 40.444 | 10000.0 | 404440 | 304.44 % |
| 05-10-2020 | 40.937 | 10000.0 | 409370 | 309.37 % |
| 05-11-2020 | 43.248 | 10000.0 | 432480 | 332.48 % |
| 07-12-2020 | 46.764 | 10000.0 | 467640 | 367.64 % |
| 05-01-2021 | 49.463 | 10000.0 | 494630 | 394.63 % |
| 05-02-2021 | 51.067 | 10000.0 | 510670 | 410.67 % |
| 05-03-2021 | 52.245 | 10000.0 | 522450 | 422.45 % |
| 05-04-2021 | 50.767 | 10000.0 | 507670 | 407.67 % |
| 05-05-2021 | 50.911 | 10000.0 | 509110 | 409.11 % |
| 07-06-2021 | 54.562 | 10000.0 | 545620 | 445.62 % |
| 05-07-2021 | 55.46 | 10000.0 | 554600 | 454.6 % |
| 05-08-2021 | 57.441 | 10000.0 | 574410 | 474.41 % |
| 06-09-2021 | 59.634 | 10000.0 | 596340 | 496.34 % |
| 05-10-2021 | 60.836 | 10000.0 | 608360 | 508.36 % |
| 08-11-2021 | 62.99 | 10000.0 | 629900 | 529.9 % |
| 06-12-2021 | 58.775 | 10000.0 | 587750 | 487.75 % |
| 05-01-2022 | 61.515 | 10000.0 | 615150 | 515.15 % |
| 07-02-2022 | 59.979 | 10000.0 | 599790 | 499.79 % |
| 07-03-2022 | 53.634 | 10000.0 | 536340 | 436.34 % |
| 05-04-2022 | 60.0967 | 10000.0 | 600967 | 500.97 % |
| 05-05-2022 | 55.3118 | 10000.0 | 553118 | 453.12 % |
| 06-06-2022 | 54.2038 | 10000.0 | 542038 | 442.04 % |
| 05-07-2022 | 52.4902 | 10000.0 | 524902 | 424.9 % |
| 05-08-2022 | 57.6641 | 10000.0 | 576641 | 476.64 % |
| 05-09-2022 | 58.5844 | 10000.0 | 585844 | 485.84 % |
| 06-10-2022 | 57.6888 | 10000.0 | 576888 | 476.89 % |
| 07-11-2022 | 59.2989 | 10000.0 | 592989 | 492.99 % |
| 05-12-2022 | 60.2931 | 10000.0 | 602931 | 502.93 % |
| 05-01-2023 | 58.5457 | 10000.0 | 585457 | 485.46 % |
| 06-02-2023 | 57.7348 | 10000.0 | 577348 | 477.35 % |
| 06-03-2023 | 57.4732 | 10000.0 | 574732 | 474.73 % |
| 05-04-2023 | 56.9853 | 10000.0 | 569853 | 469.85 % |
| 05-05-2023 | 58.5992 | 10000.0 | 585992 | 485.99 % |
| 05-06-2023 | 61.2583 | 10000.0 | 612583 | 512.58 % |
| 05-07-2023 | 64.0921 | 10000.0 | 640921 | 540.92 % |
| 07-08-2023 | 65.3682 | 10000.0 | 653682 | 553.68 % |
| 05-09-2023 | 66.8413 | 10000.0 | 668413 | 568.41 % |
| 05-10-2023 | 66.2462 | 10000.0 | 662462 | 562.46 % |
| 06-11-2023 | 66.8154 | 10000.0 | 668154 | 568.15 % |
| 05-12-2023 | 73.4473 | 10000.0 | 734473 | 634.47 % |
| 05-01-2024 | 77.2609 | 10000.0 | 772609 | 672.61 % |
| 05-02-2024 | 78.2426 | 10000.0 | 782426 | 682.43 % |
| 05-03-2024 | 80.169 | 10000.0 | 801690 | 701.69 % |
| 05-04-2024 | 82.4161 | 10000.0 | 824161 | 724.16 % |
| 06-05-2024 | 84.423 | 10000.0 | 844230 | 744.23 % |
| 05-06-2024 | 83.7374 | 10000.0 | 837374 | 737.37 % |
| 05-07-2024 | 92.5823 | 10000.0 | 925823 | 825.82 % |
| 05-08-2024 | 89.6912 | 10000.0 | 896912 | 796.91 % |
| 05-09-2024 | 95.3283 | 10000.0 | 953283 | 853.28 % |
| 07-10-2024 | 94.3083 | 10000.0 | 943083 | 843.08 % |
| 05-11-2024 | 93.8445 | 10000.0 | 938445 | 838.44 % |
| 05-12-2024 | 98.2181 | 10000.0 | 982181 | 882.18 % |
| 06-01-2025 | 94.3771 | 10000.0 | 943771 | 843.77 % |
| 05-02-2025 | 91.1094 | 10000.0 | 911094 | 811.09 % |
| 05-03-2025 | 83.806 | 10000.0 | 838060 | 738.06 % |
| 07-04-2025 | 83.0091 | 10000.0 | 830091 | 730.09 % |
| 05-05-2025 | 90.9749 | 10000.0 | 909749 | 809.75 % |
| 05-06-2025 | 94.0135 | 10000.0 | 940135 | 840.14 % |
| 07-07-2025 | 95.5132 | 10000.0 | 955132 | 855.13 % |
| 05-08-2025 | 94.2323 | 10000.0 | 942323 | 842.32 % |
| 05-09-2025 | 94.5083 | 10000.0 | 945083 | 845.08 % |
| 10-09-2025 | 95.3574 | 10000.0 | 953574 | 853.57 % |
RETURNS CALCULATOR for BARODA BNP PARIBAS ELSS Tax Saver Fund - Regular - Growth Option
Growth of 10000 In SIP (Fund vs Benchmark)
Growth of 10000 In LUMPSUM (Fund vs Benchmark)
Rolling Returns
Rolling returns are the annualized returns of the scheme taken for a specified period (rolling returns period) on every day/week/month and taken till the last day of the duration. In this chart we are showing the annualized returns over the rolling returns period on every day from the start date and comparing it with the benchmark. Rolling returns is the best measure of a fund's performance. Trailing returns have a recency bias and point to point returns are specific to the period in consideration. Rolling returns, on the other hand, measures the fund's absolute and relative performance across all timescales, without bias.
Market Cap Distribution
Small Cap
17.65%
Others
3.85%
NA
0.0%
Large Cap
58.15%
Mid Cap
20.35%
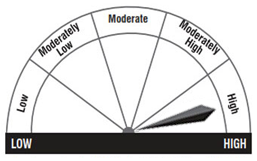
Riskometer
Key Performance and Risk Statistics of BARODA BNP PARIBAS ELSS Tax Saver Fund - Regular - Growth Option
| Key Statistics | Volatility | Sharpe Ratio | Alpha | Beta | Yield to Maturity | Average Maturity |
|---|---|---|---|---|---|---|
| BARODA BNP PARIBAS ELSS Tax Saver Fund - Regular - Growth Option | 12.77 | 0.81 | 2.06 | 0.95 | - | - |
| Equity: ELSS | - | - | - | - | - | - |
PEER COMPARISION of BARODA BNP PARIBAS ELSS Tax Saver Fund - Regular - Growth Option
| Scheme Name | Launch Date |
1-Year Ret (%) |
2-Yrs Ret (%) |
3-Yrs Ret (%) |
5-Yrs Ret (%) |
10-Yrs Ret (%) |
|---|---|---|---|---|---|---|
| BARODA BNP PARIBAS ELSS Tax Saver Fund - Regular - Growth Option | 05-01-2006 | 0.28 | 18.45 | 17.04 | 18.82 | 12.66 |
| Parag Parikh ELSS Tax Saver Fund- Regular Growth | 07-07-2019 | 5.36 | 17.79 | 17.72 | 22.39 | 0.0 |
| HSBC Tax Saver Equity Fund - Growth | 05-01-2007 | 4.46 | 20.78 | 18.19 | 22.08 | 13.76 |
| WhiteOak Capital ELSS Tax Saver Fund Regular Plan Growth | 14-10-2022 | 4.18 | 20.4 | 0.0 | 0.0 | 0.0 |
| HDFC ELSS Tax saver - Growth Plan | 05-03-1996 | 3.74 | 21.33 | 21.0 | 25.33 | 14.39 |
| Sundaram ELSS Tax Saver Fund Regular Growth | 01-01-2013 | 0.93 | 14.03 | 13.92 | 20.66 | 14.36 |
| Aditya Birla Sun Life ELSS Tax Saver Fund - Growth Option | 29-03-1996 | 0.63 | 15.54 | 13.34 | 14.11 | 11.3 |
| Mirae Asset ELSS Tax Saver Fund - Regular Plan - Growth | 01-12-2015 | 0.58 | 15.57 | 15.86 | 21.27 | 0.0 |
| PGIM India ELSS Tax Saver Fund - Regular Plan - Growth Option | 11-12-2015 | 0.55 | 11.53 | 12.54 | 20.14 | 0.0 |
| ICICI Prudential ELSS Tax Saver Fund - Growth | 19-08-1999 | 0.38 | 16.47 | 15.7 | 21.17 | 13.64 |
PORTFOLIO ANALYSIS of BARODA BNP PARIBAS ELSS Tax Saver Fund - Regular - Growth Option
Asset Allocation (%)
| Allocation | Percentage (%) |
|---|